Skip to content
Kleanoo
The Eco-Network
KleanooKleanoo
  • Compra & VendiIn modo semplice, veloce e sicuro
  • Portale NotizieTecnologie, innovazioni e normative
  • Pronta ConsegnaVeicoli in pronta consegna by Vakoom
  • ContattiHai un dubbio o una domanda?
Chiudi Menu
  • Compra & VendiIn modo semplice, veloce e sicuro
  • Portale NotizieTecnologie, innovazioni e normative
  • Pronta ConsegnaVeicoli in pronta consegna by Vakoom
  • ContattiHai un dubbio o una domanda?

EUROSTAT: WHERE DOES OUR RECYCLABLE WASTE GO? IN PARTICULAR IN SOUTH-EAST ASIA.

You are here:
  1. Home
  2. Environment
  3. EUROSTAT: WHERE DOES OUR RECYCLABLE…
EnvironmentEUROSTAT RECYCLABLE WASTE

The Eurostat has recently published the data on waste and recyclable materials exports between 2016 and 2019, showing a new but not necessarily better geographical scenario in terms of environmental impact. With China banning on trade in four classes and 24 types of solid waste in 2017, it became necessary to physically change the direction of these exports, moving paper and plastic waste to other countries, in particular Turkey, Malaysia, Indonesia and other Asian countries. There were 1.4 million tonnes of plastic waste that the European Union exported to China before the closure, then fell to 50 thousand tonnes in 2018 and 14 thousand tonnes in 2019. Subsequently, plastic waste from the EU was diverted to the three countries quoted above (in Malaysia 24% of exports, in Turkey 17%, in Indonesia 6%).

The paper instead has undergone a gradual change of direction and size: if in 2016 in China we exported 7.4 million tons of waste as EU, today the number is about 5.9 million, while other countries chosen to receive our paper were mainly India (19%), Indonesia (17%), Turkey (12%) and Thailand (10%).

Eurostat data, however, do not explain how many materials were also stuck in Italy or Europe for lack of real management: there is therefore an unspecified number of submerged waste, perhaps stuck in the plants, abandoned or simply disposed of in ways not properly legal. A problem that highlights a real crisis with regard to our number of plants sufficient to dispose of the enormous amount of recyclable (and not) waste and that makes us dependent on countries especially in South-East Asia, worsening with considerable economic and environmental costs. A problem exacerbated in the first months of 2020, where due to the pandemic closure of some activities in the countries where we export the most, the waste remained at a standstill, saturating the plants in a short time.

KLEANOO EDITORIAL STAFF

Kleanoo © 2025 — Reproduction prohibited

Condividi questo articolo
Share on FacebookShare on Facebook Share on XShare on X Share on LinkedInShare on LinkedIn Share on WhatsAppShare on WhatsApp

Leggi anche

bidoni differenziata
New MEC for municipal waste
9 August 2022
raccolta carta e cartone
New record for paper and cardboard collection in 2021
2 August 2022
trattamento acque reflue
Treat wastewater to produce green hydrogen
26 July 2022
digitalizzazione
R.E.N.T.Ri at Waste Management Europe
19 July 2022
wastewater containers
Veritas returnes 99.6% of purified water to the environment
14 June 2022
irrigazione in agricoltura
Purified wastewater to fight drought
7 June 2022
Richiedi informazioni

Questo veicolo si trova in un sito esterno. Per informazioni chiamaci al +39 353 439 9515 oppure compila il form sottostante.

    I dati si intendono forniti a semplice titolo indicativo e non impegnativo. Kleanoo si riserva di apportare modifiche in qualunque momento e senza pubblico avviso.

    EUROSTAT: WHERE DOES OUR RECYCLABLE WASTE GO? IN PARTICULAR IN SOUTH-EAST ASIA.

    You are here:
    1. Home
    2. Meio Ambiente/Sustentabilidade
    3. EUROSTAT: WHERE DOES OUR RECYCLABLE…
    Meio Ambiente/Sustentabilidadeeurostat rifiuti riciclabili

    The Eurostat has recently published the data on waste and recyclable materials exports between 2016 and 2019, showing a new but not necessarily better geographical scenario in terms of environmental impact. With China banning on trade in four classes and 24 types of solid waste in 2017, it became necessary to physically change the direction of these exports, moving paper and plastic waste to other countries, in particular Turkey, Malaysia, Indonesia and other Asian countries. There were 1.4 million tonnes of plastic waste that the European Union exported to China before the closure, then fell to 50 thousand tonnes in 2018 and 14 thousand tonnes in 2019. Subsequently, plastic waste from the EU was diverted to the three countries quoted above (in Malaysia 24% of exports, in Turkey 17%, in Indonesia 6%).

    The paper instead has undergone a gradual change of direction and size: if in 2016 in China we exported 7.4 million tons of waste as EU, today the number is about 5.9 million, while other countries chosen to receive our paper were mainly India (19%), Indonesia (17%), Turkey (12%) and Thailand (10%).

    Eurostat data, however, do not explain how many materials were also stuck in Italy or Europe for lack of real management: there is therefore an unspecified number of submerged waste, perhaps stuck in the plants, abandoned or simply disposed of in ways not properly legal. A problem that highlights a real crisis with regard to our number of plants sufficient to dispose of the enormous amount of recyclable (and not) waste and that makes us dependent on countries especially in South-East Asia, worsening with considerable economic and environmental costs. A problem exacerbated in the first months of 2020, where due to the pandemic closure of some activities in the countries where we export the most, the waste remained at a standstill, saturating the plants in a short time.

    PUBLICAÇÕES DAS Kleanoo
    Kleanoo © 2025 — Proibida a reprodução
    Condividi questo articolo
    Share on FacebookShare on Facebook Share on XShare on X Share on LinkedInShare on LinkedIn Share on WhatsAppShare on WhatsApp

    Leggi anche

    trattamento acque reflue
    Treat wastewater to produce green hydrogen
    26 July 2022
    silos di acque reflue
    Veritas returnes 99.6% of purified water to the environment
    14 June 2022
    irrigazione in agricoltura
    Purified wastewater to fight drought
    7 June 2022
    ladurner equipment full electric
    Full electric vehicles of Ladurner Equipment in Naples: waste collection changes
    24 May 2022
    emissioni industriali
    Producing energy from waste: first italian zero-emission biorefinery
    17 May 2022
    asfalto con impronte di scarpe
    Modified asphalts: new life for ELT-recycled rubber
    10 May 2022

    Eurostat: dove vanno i nostri rifiuti riciclabili? Soprattutto nel sud est asiatico.

    You are here:
    1. Home
    2. Ecologia
    3. Eurostat: dove vanno i nostri…
    Ecologiaeurostat rifiuti riciclabili

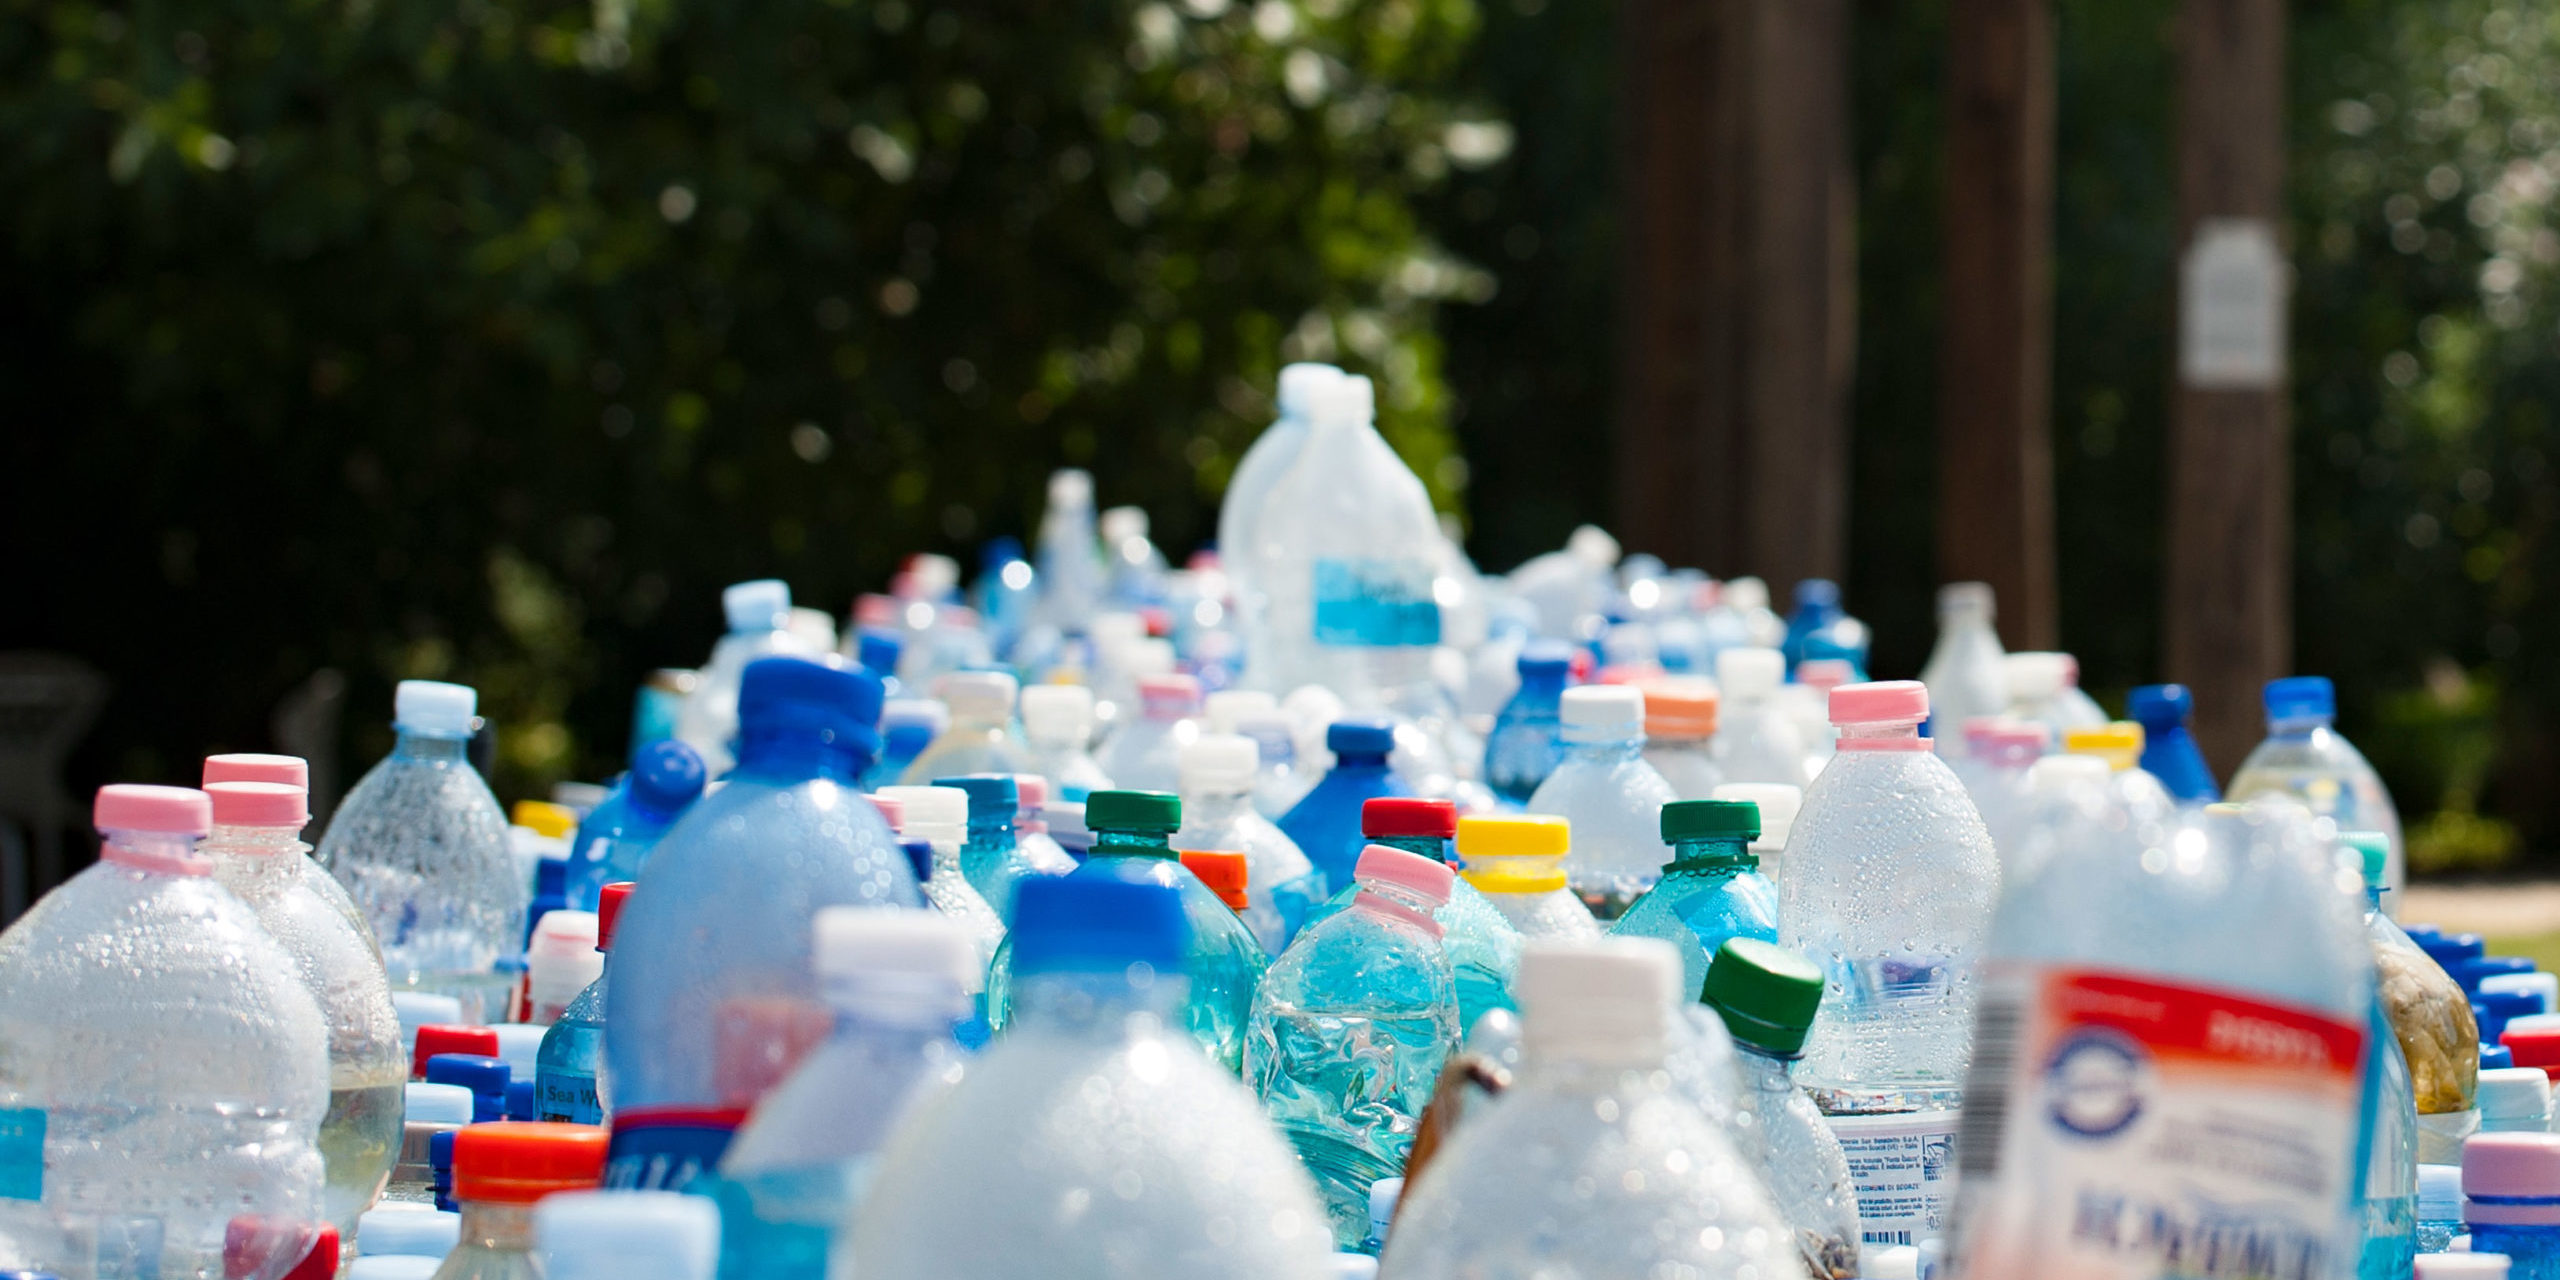
    L’Eurostat ha pubblicato recentemente i dati sull’esportazione di rifiuti e di materiali riciclabili compresi tra gli anni 2016 e 2019, mostrando uno scenario geografico nuovo ma non necessariamente migliore dal punto di vista dell’impatto ambientale. Con il divieto nel 2017 da parte della Cina del commercio di quattro classi e 24 tipi di rifiuti solidi, si è reso necessario cambiare fisicamente rotta a questo tipo di esportazioni, spostando i rifiuti di carta e plastica verso altri Paesi, in particolare la Turchia, la Malesia, l’Indonesia ed altre nazioni asiatiche. Erano 1,4 milioni di tonnellate i rifiuti di plastica che l’Unione Europea esportava in Cina prima della chiusura, poi scesi a 50mila tonnellate nel 2018 e a 14mila tonnellate nel 2019. Successivamente, i rifiuti di plastica dall’Ue sono stati deviati verso i tre Paesi sovra-citati (in Malesia il 24% delle esportazioni, in Turchia il 17%, in Indonesia il 6%).

    La carta invece ha subìto un graduale cambio di rotta e di dimensioni: se nel 2016 in Cina esportavamo come Ue 7,4 milioni di tonnellate di rifiuti nel 2016, oggi la cifra è di circa 5,8 milioni, mentre gli altri Paesi scelti perché ricevessero la nostra carta sono stati soprattutto l’India (il 19%), l’Indonesia (il 17%), la Turchia (il 12%) fino ad arrivare alla Thailandia (il 10%).

    I dati dell’Eurostat tuttavia non spiegano quanti materiali sono rimasti altresì bloccati in Italia o in Europa per mancanza di reale gestione: esiste quindi un numero imprecisato di rifiuti sommersi, magari bloccati negli impianti, abbandonati o che semplicemente sono stati smaltiti in vie non propriamente legali. Un problema che evidenzia una crisi reale per quanto concerne il nostro numero di impianti sufficienti a smaltire l’enorme quantità di rifiuti riciclabili (e non) e che ci rende dipendenti dai Paesi specialmente del sud est asiatico, aggravandosi con costi economici e ambientali non indifferenti. Un problema acuito nei primi mesi del 2020, dove a causa della chiusura per la pandemia di alcune attività nei Paesi dove esportiamo di più, i rifiuti sono rimasti fermi saturando in breve tempo gli impianti.

    Redazione Kleanoo
    Kleanoo © 2025 — Vietata la riproduzione
    Condividi questo articolo
    Share on FacebookShare on Facebook Share on XShare on X Share on LinkedInShare on LinkedIn Share on WhatsAppShare on WhatsApp

    Leggi anche

    bidoni differenziata
    Pubblicati i nuovi CAM per i rifiuti urbani
    9 August 2022
    raccolta carta e cartone
    Nuovo record per la raccolta di carta e cartone nel 2021
    2 August 2022
    trattamento acque reflue
    Depurare le acque reflue per produrre idrogeno verde
    26 July 2022
    digitalizzazione
    R.E.N.T.Ri al Waste Management Europe
    19 July 2022
    silos di acque reflue
    Veritas restituisce all’ambiente il 99,6% di acque depurate
    14 June 2022
    irrigazione in agricoltura
    Acque reflue depurate per combattere la siccità
    7 June 2022

    EUROSTAT: WHERE DOES OUR RECYCLABLE WASTE GO? IN PARTICULAR IN SOUTH-EAST ASIA.

    You are here:
    1. Home
    2. Ecología
    3. EUROSTAT: WHERE DOES OUR RECYCLABLE…
    Ecología

    The Eurostat has recently published the data on waste and recyclable materials exports between 2016 and 2019, showing a new but not necessarily better geographical scenario in terms of environmental impact. With China banning on trade in four classes and 24 types of solid waste in 2017, it became necessary to physically change the direction of these exports, moving paper and plastic waste to other countries, in particular Turkey, Malaysia, Indonesia and other Asian countries. There were 1.4 million tonnes of plastic waste that the European Union exported to China before the closure, then fell to 50 thousand tonnes in 2018 and 14 thousand tonnes in 2019. Subsequently, plastic waste from the EU was diverted to the three countries quoted above (in Malaysia 24% of exports, in Turkey 17%, in Indonesia 6%).

    The paper instead has undergone a gradual change of direction and size: if in 2016 in China we exported 7.4 million tons of waste as EU, today the number is about 5.9 million, while other countries chosen to receive our paper were mainly India (19%), Indonesia (17%), Turkey (12%) and Thailand (10%).

    Eurostat data, however, do not explain how many materials were also stuck in Italy or Europe for lack of real management: there is therefore an unspecified number of submerged waste, perhaps stuck in the plants, abandoned or simply disposed of in ways not properly legal. A problem that highlights a real crisis with regard to our number of plants sufficient to dispose of the enormous amount of recyclable (and not) waste and that makes us dependent on countries especially in South-East Asia, worsening with considerable economic and environmental costs. A problem exacerbated in the first months of 2020, where due to the pandemic closure of some activities in the countries where we export the most, the waste remained at a standstill, saturating the plants in a short time.

    REDACCIÓN KLEANOO
    Kleanoo © 2025 — Prohibida la reproducción
    Condividi questo articolo
    Share on FacebookShare on Facebook Share on XShare on X Share on LinkedInShare on LinkedIn Share on WhatsAppShare on WhatsApp

    Leggi anche

    trattamento acque reflue
    Treat wastewater to produce green hydrogen
    26 July 2022
    silos di acque reflue
    Veritas returnes 99.6% of purified water to the environment
    14 June 2022
    irrigazione in agricoltura
    Purified wastewater to fight drought
    7 June 2022
    ladurner equipment full electric
    Full electric vehicles of Ladurner Equipment in Naples: waste collection changes
    24 May 2022
    emissioni industriali
    Producing energy from waste: first italian zero-emission biorefinery
    17 May 2022
    asfalto con impronte di scarpe
    Modified asphalts: new life for ELT-recycled rubber
    10 May 2022
    Informazioni di Contatto
    Utilizza i recapiti sottostanti per poterti mettere in contatto con un membro del nostro team. In alternativa puoi compilare il form per inviarci un messaggio.
    • Indirizzo
      Via Marco Beato Ongaro 11
      31015 Conegliano (TV)
    • Telefono
      +39 353 439 9515
      +39 0438 1963696
    • E-mail
      info@kleanoo.com

      Kleanoo
      Kleanoo © 2025
      Kleanoo è un marchio registrato di Vakoom Srl
      Partita IVA: IT 03945270266
      Site design by ADMP
      • Privacy Policy
      • Cookie Policy
      Menu Footer

      Go to Top